Most survey results in Power BI end up in a stacked bar chart. Every bar starts at the left edge, so the negative and the positive answers never share a starting line. The neutral answers sit in the middle of each bar and push everything else around. You can read the numbers, but the results are much harder to judge. You don't see the sentiment clearly lean in one direction or the other.
And that is what data visualization is about: showing the pattern in a large amount of data. In a stacked bar, the pattern gets lost.
The Likert visual is built for this kind of data: answers on a scale from "I dislike them a lot" to "I like them a lot", from detractors to promoters, from "not satisfied" to "very satisfied". It places every answer where it belongs and adds the calculations readers need to make sense of the results.
Negative on the left, positive on the right
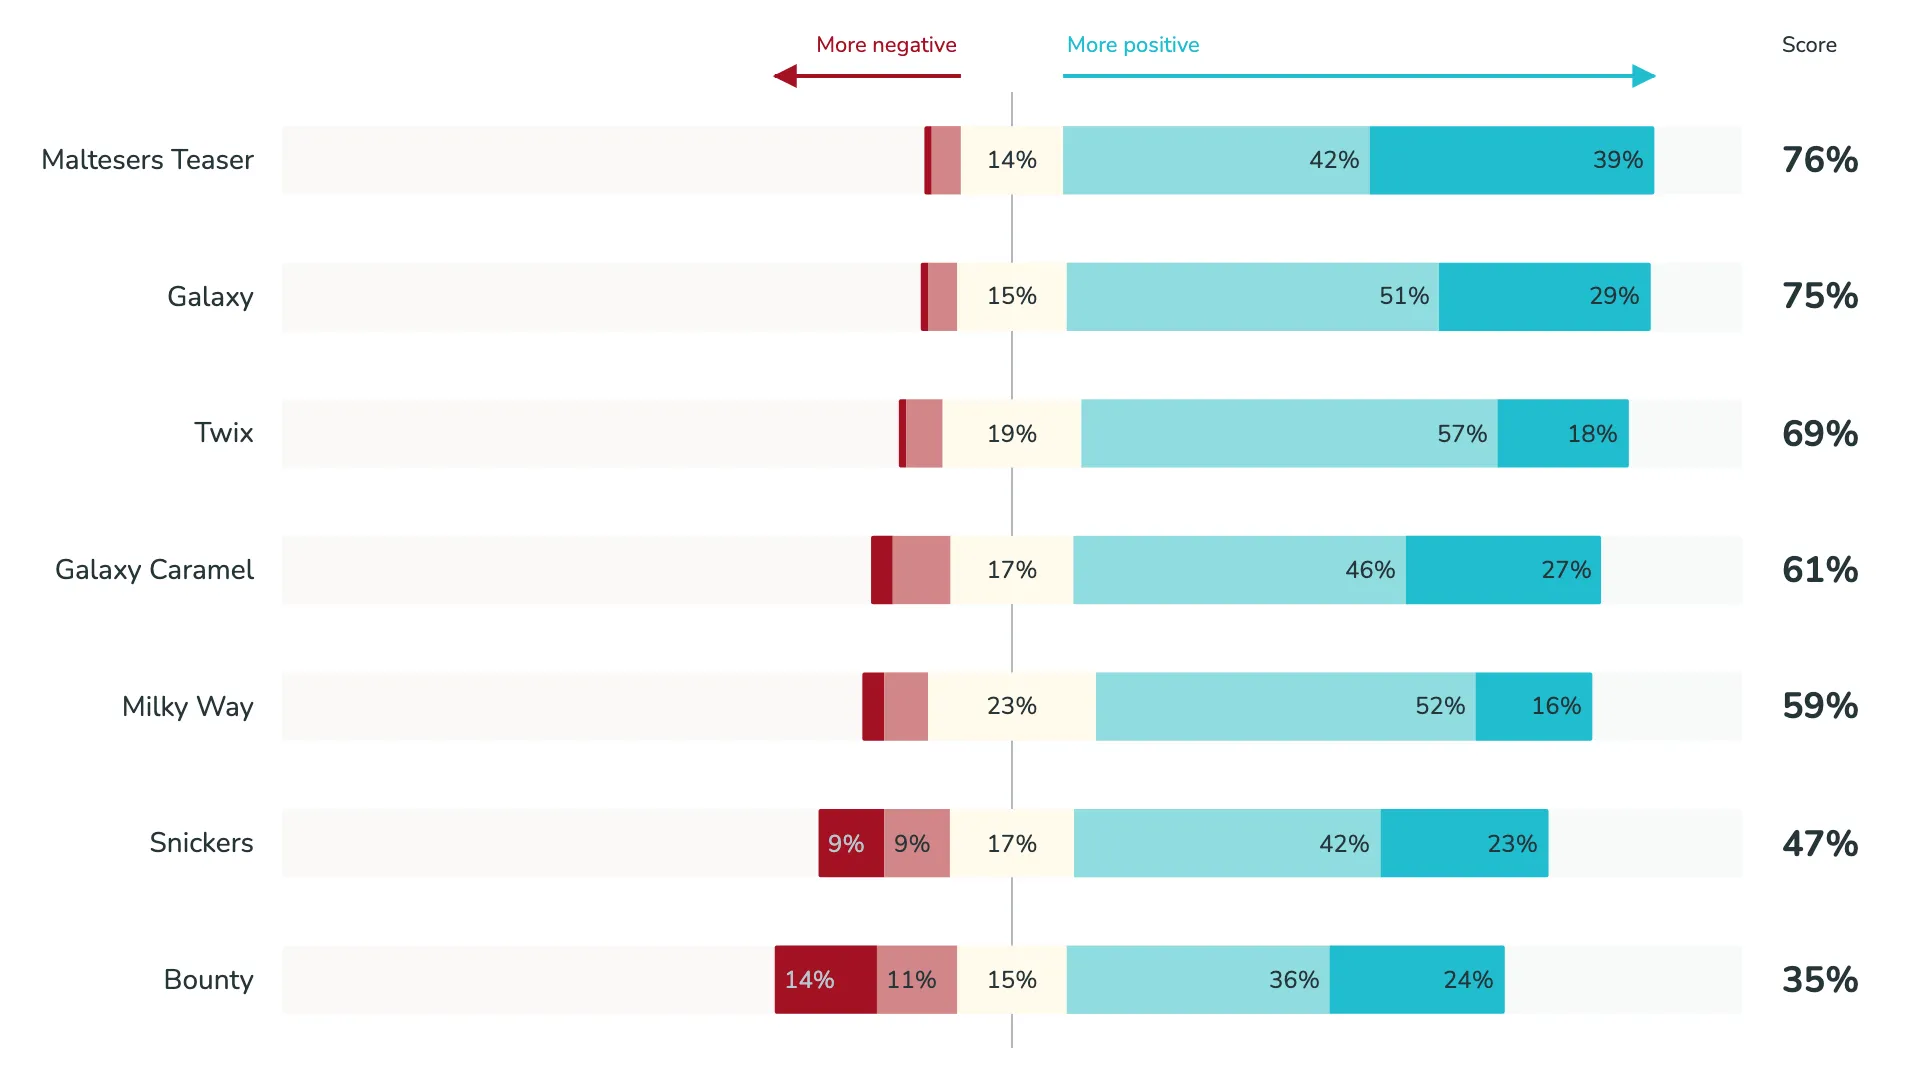
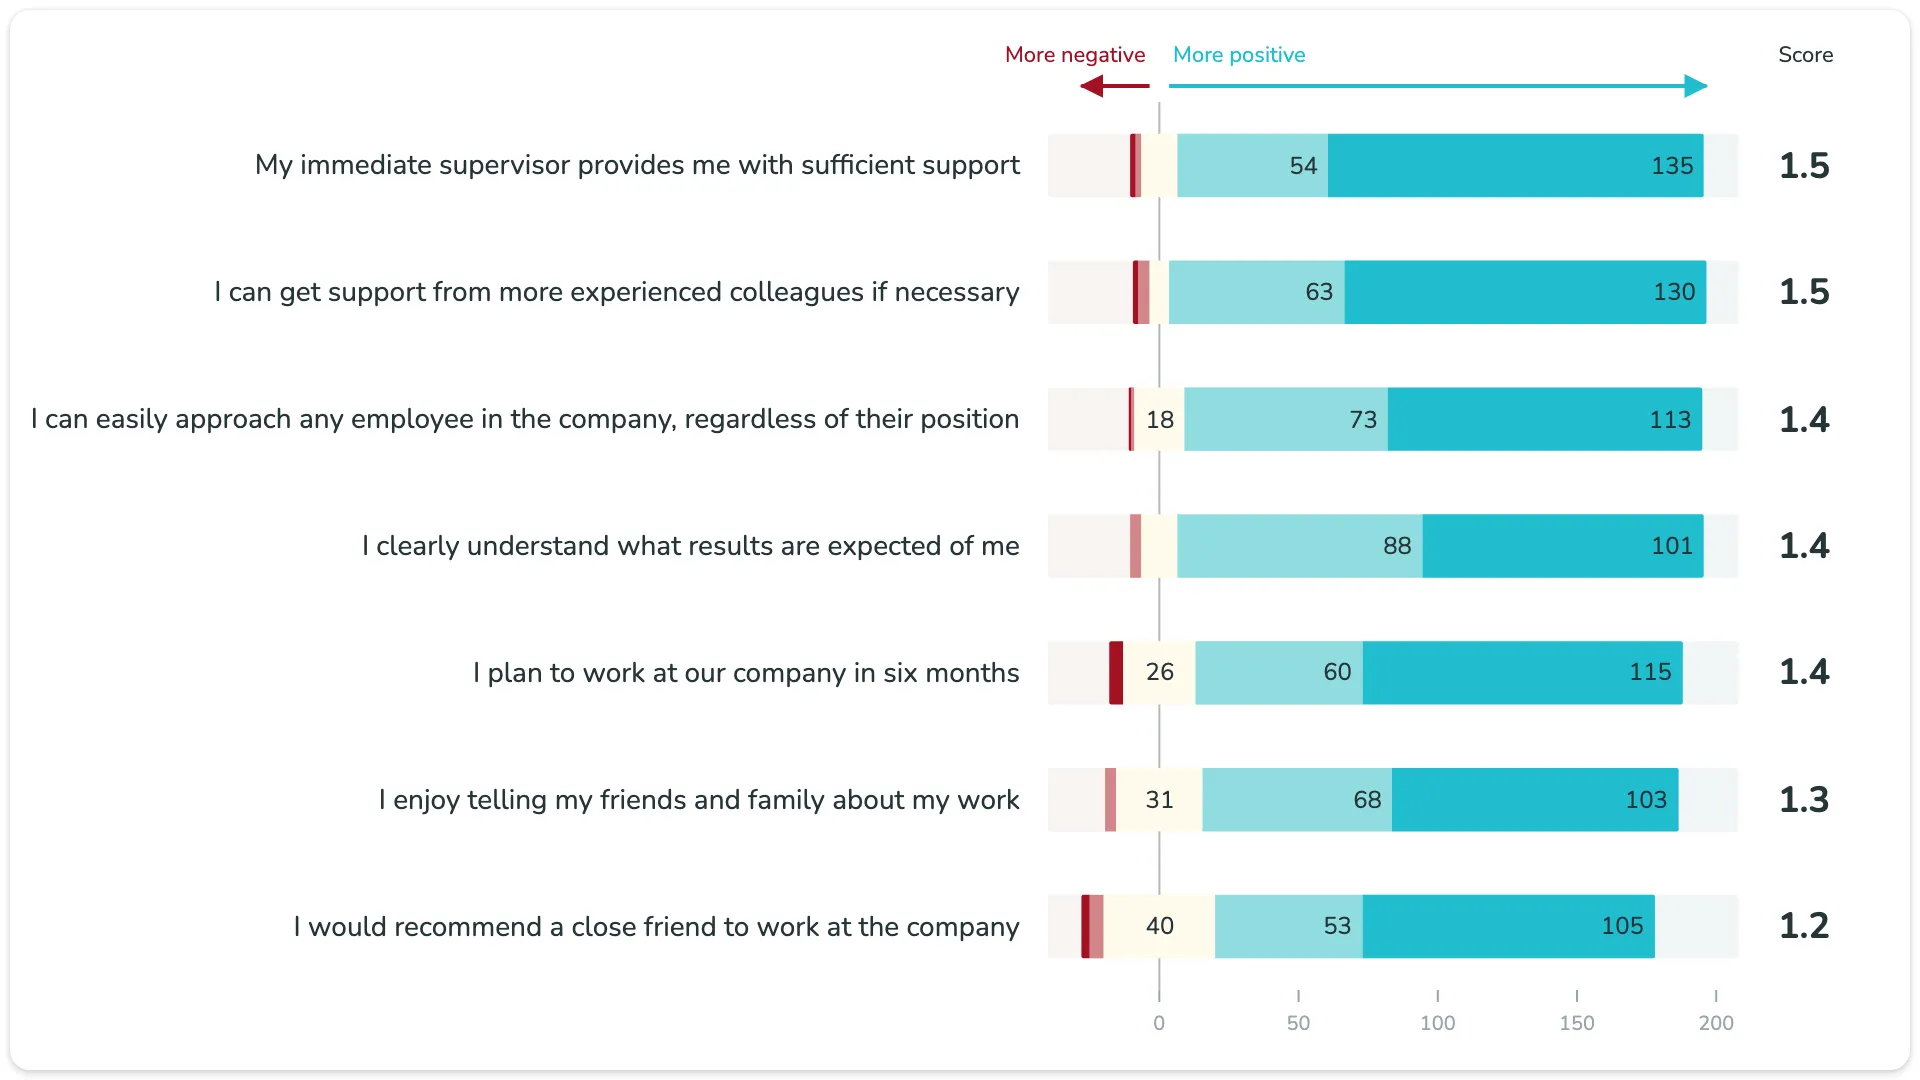
By default, the visual uses the Likert normalized layout. The neutral answers are centred on a zero line. Negative answers grow to the left, positive answers grow to the right. One look tells you which item leans positive and by how much.
Arrows that show where the survey leans
The polarity indicators above the chart are more than labels. Each arrow starts at the neutral answers and runs as far as the strongest positive or negative result across all questions. A long arrow on the right and a short one on the left: the whole survey leans positive, before you read a single bar.
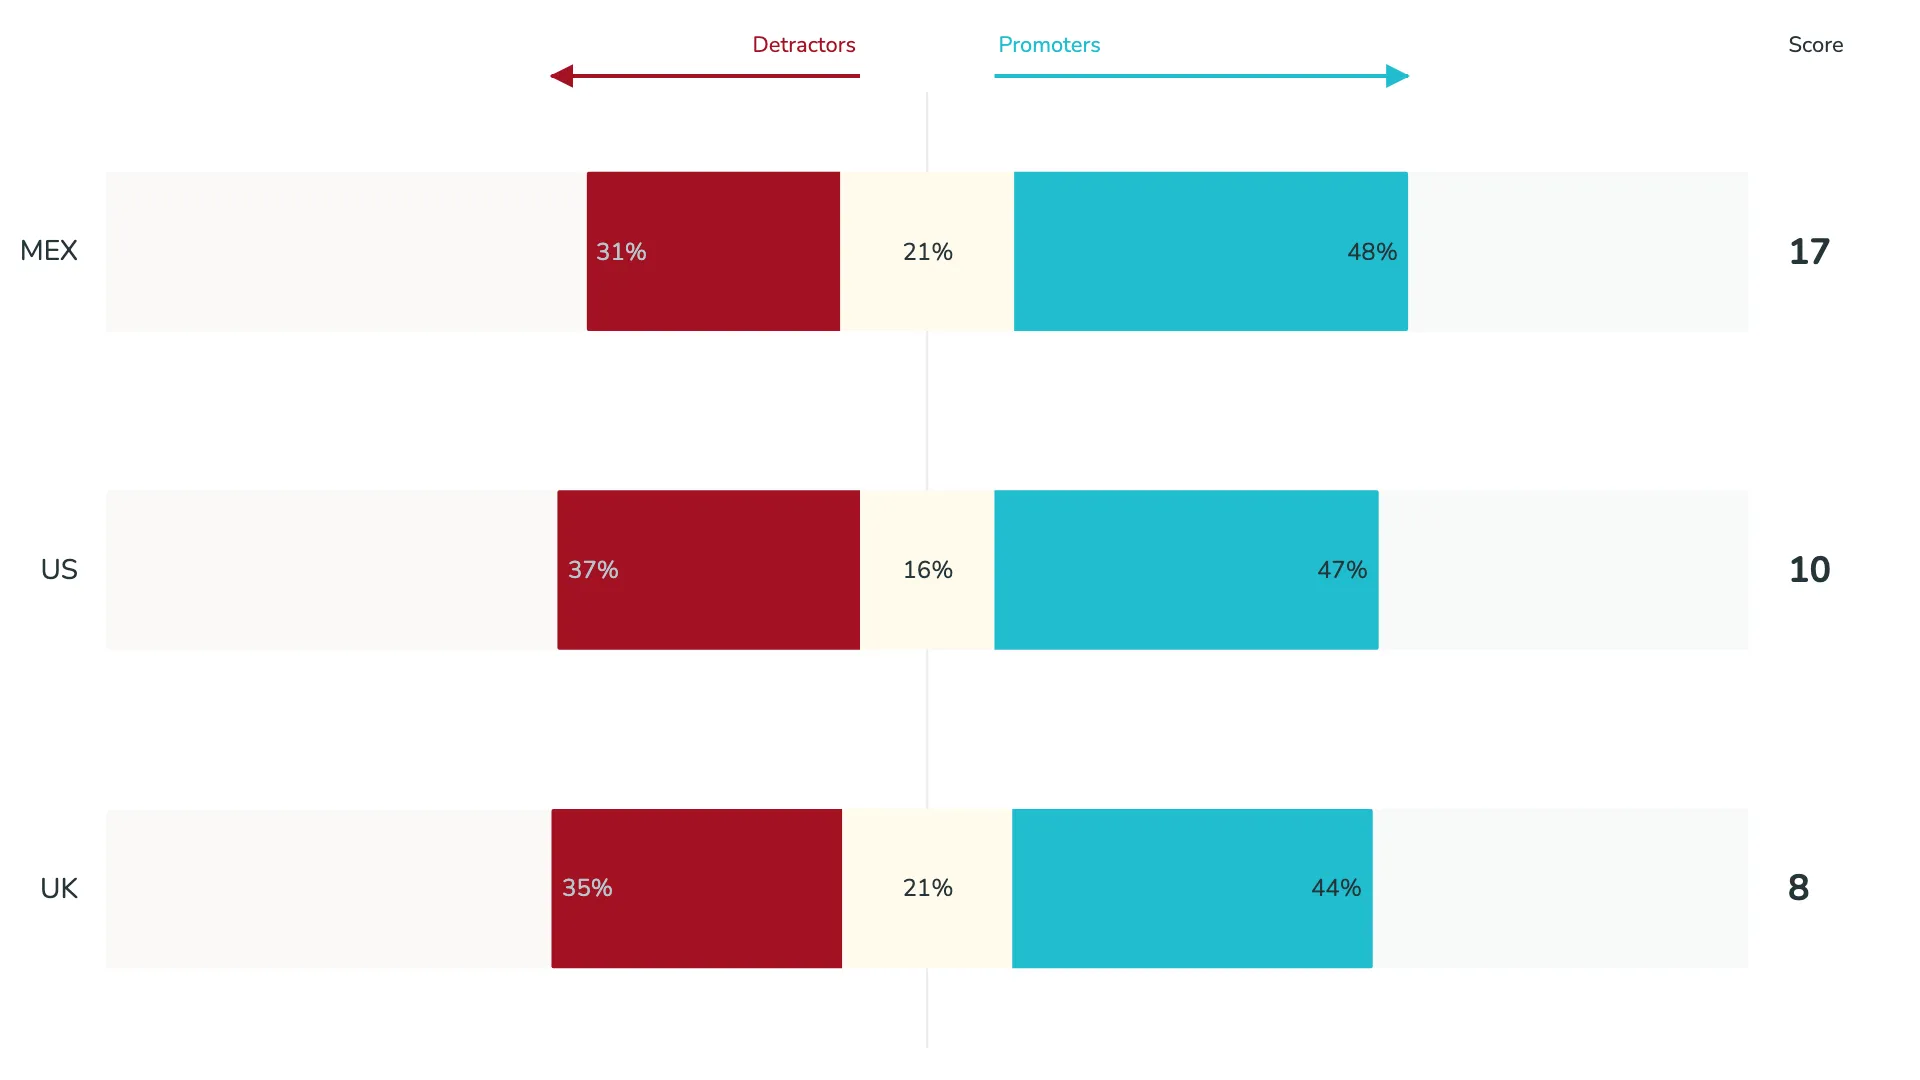
The labels are yours to change, for example "More negative" and "More positive", "I like less" and "I like more", or "Detractors" and "Promoters".
The opposite view
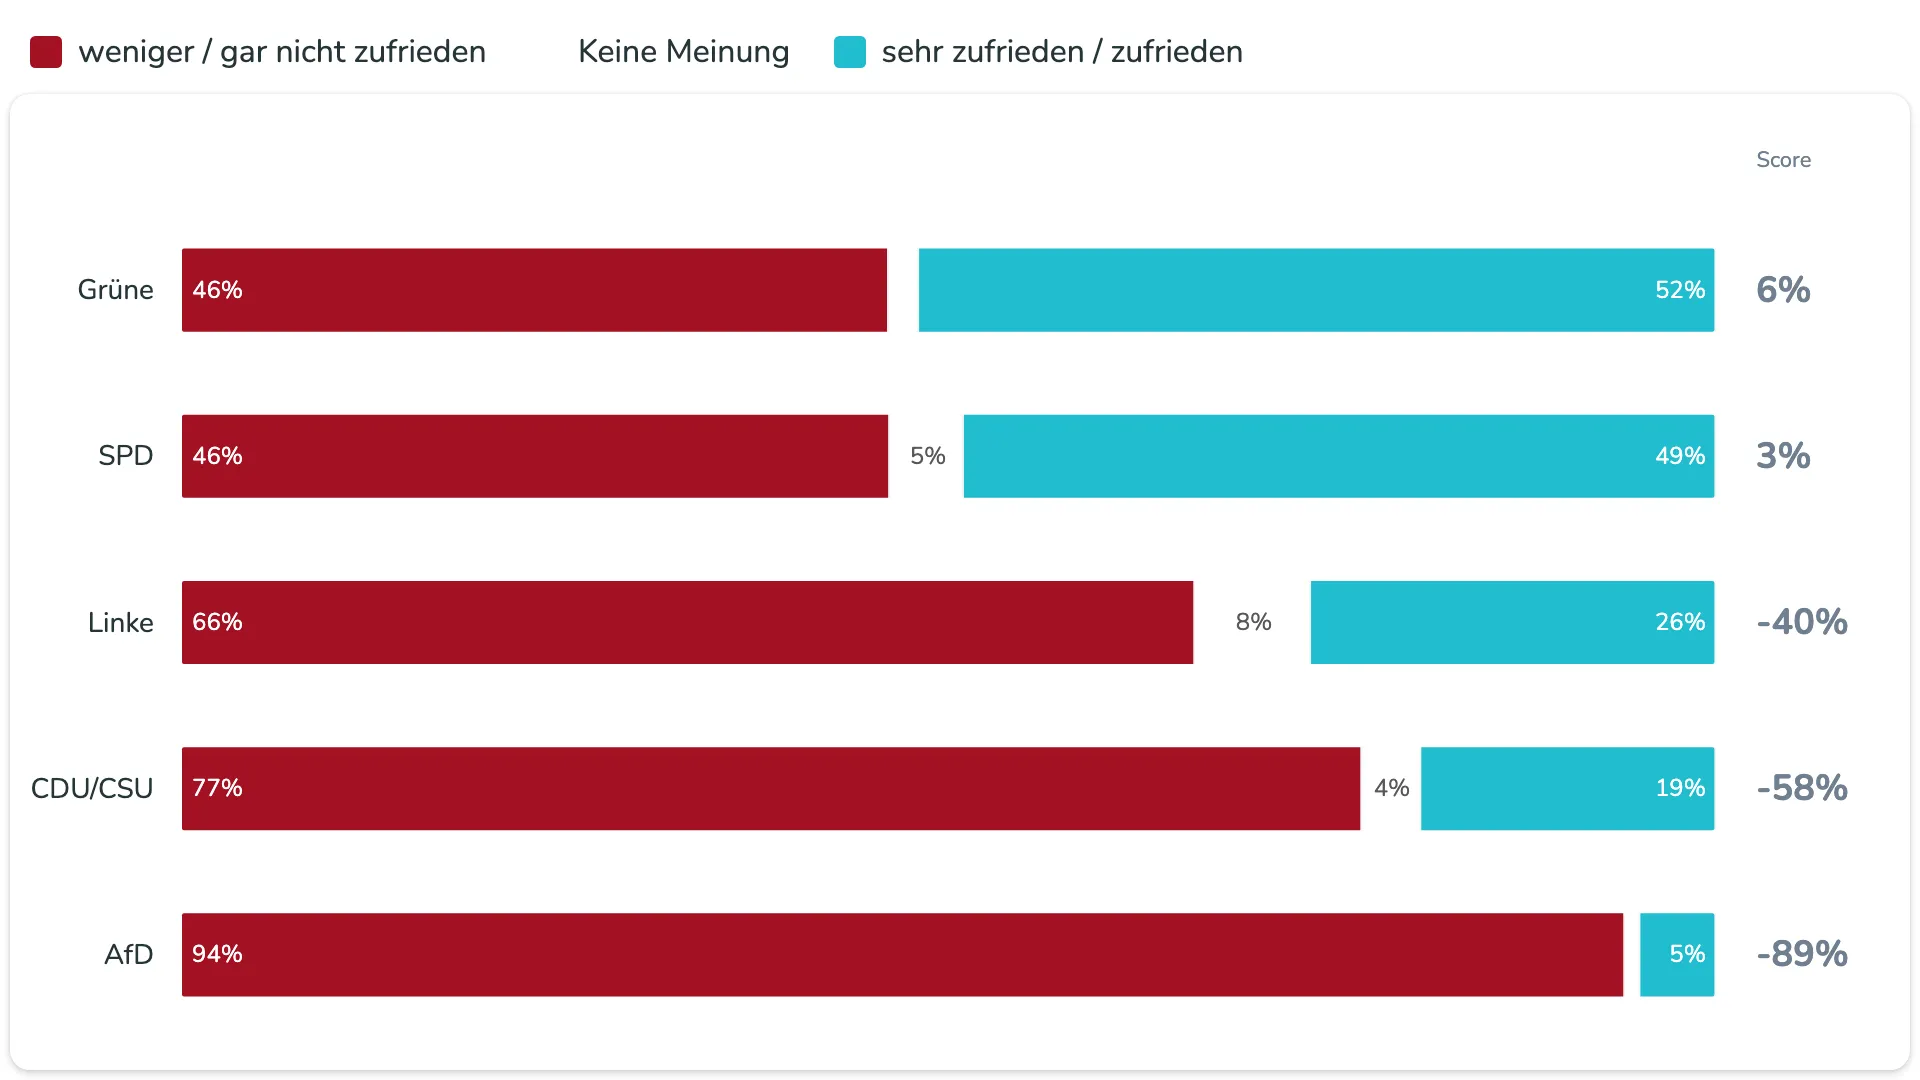
Some questions have only two or three answers, like "satisfied", "not satisfied", and "no opinion". Switch the type to Normalized, and every bar runs from 0% to 100%. Negative answers start at the left edge, positive answers end at the right edge, and the neutral share sits between them.
A score for every question
A survey rarely ends with the chart. Someone always asks: so, which one wins? The visual answers that with an overall rating column next to each item. You choose how it is calculated:
- Net score (default): the positive share minus the negative share
- NPS: promoters minus detractors
- Mean score and Mean score centered
- Top-2-Box: the share of the two most positive answers
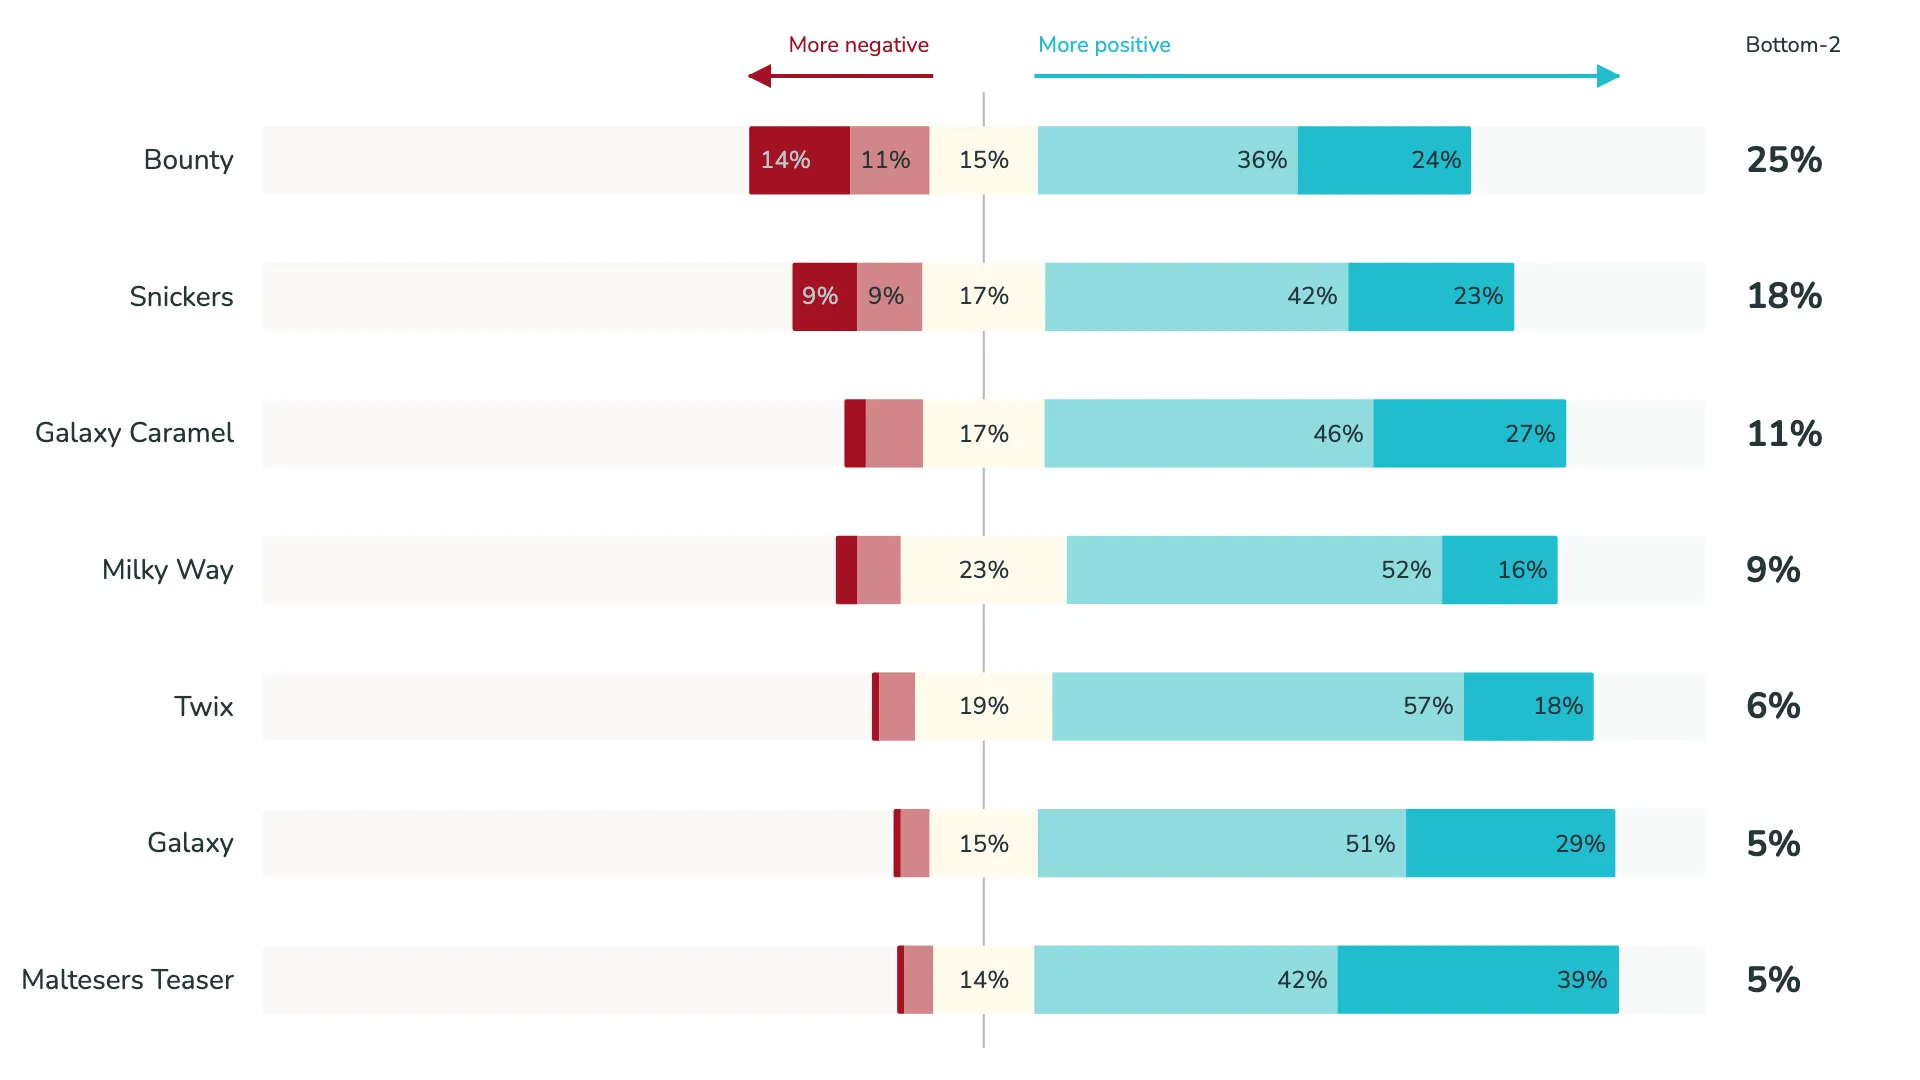
- Bottom-2-Box: the share of the two most negative answers
No DAX needed. Items are sorted by their rating, so the strongest result is at the top. You can also rename the column header, for example to "NPS" or "Bottom-2".
The Bottom-2-Box turns the question around. Instead of "what do people like?", it shows "where are the problems?". Sorted by that rating, the item with the most negative answers comes first.
Percentages or votes
Percentages make items easy to compare. But when a question got 40 answers and the next one got 200, the raw counts matter too. The Likert absolute type draws the bars by response count, and the data labels can show votes instead of percentages.
Colour by segment, not by sentiment
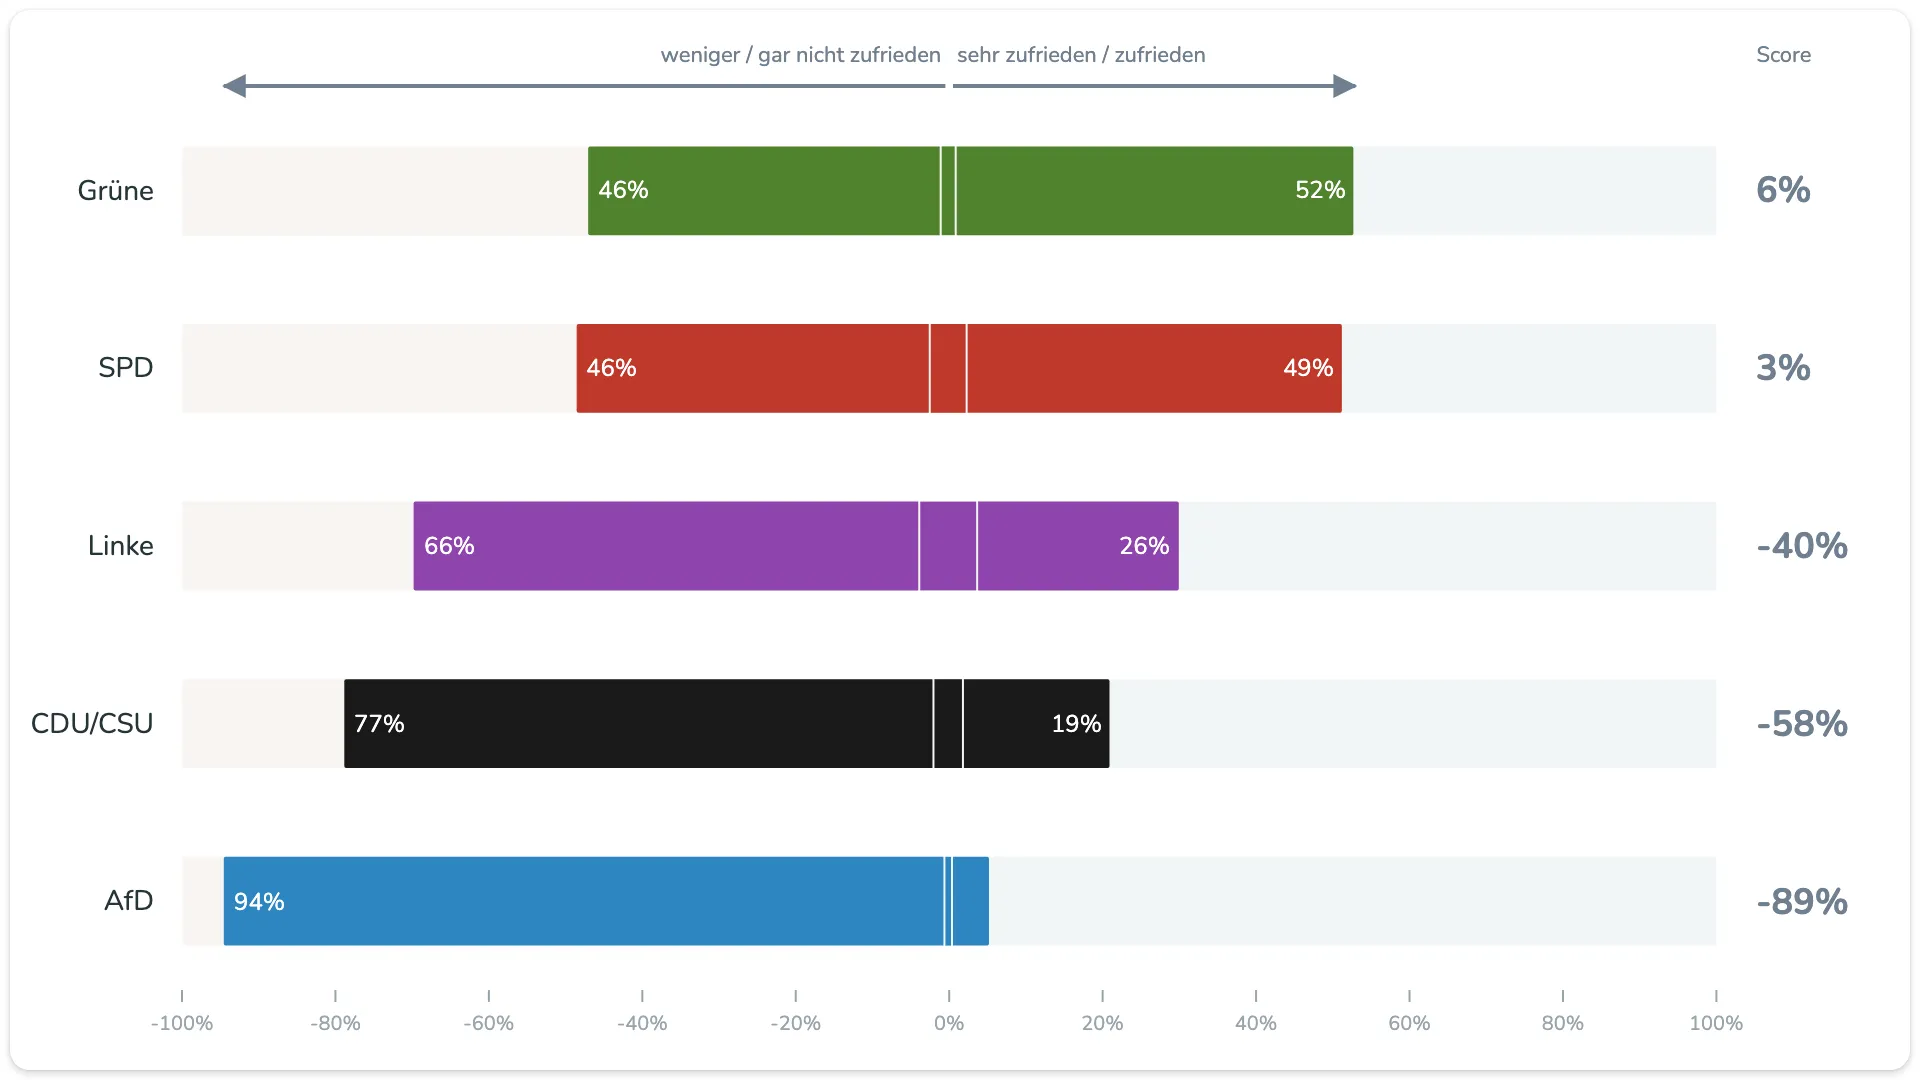
The default colours follow the sentiment: red tones for negative, teal for positive, a light colour for neutral. With Data colors, you can colour each bar by its item instead, for example each political party in its own colour. The layout still keeps negative and positive apart.
Arrows or a legend
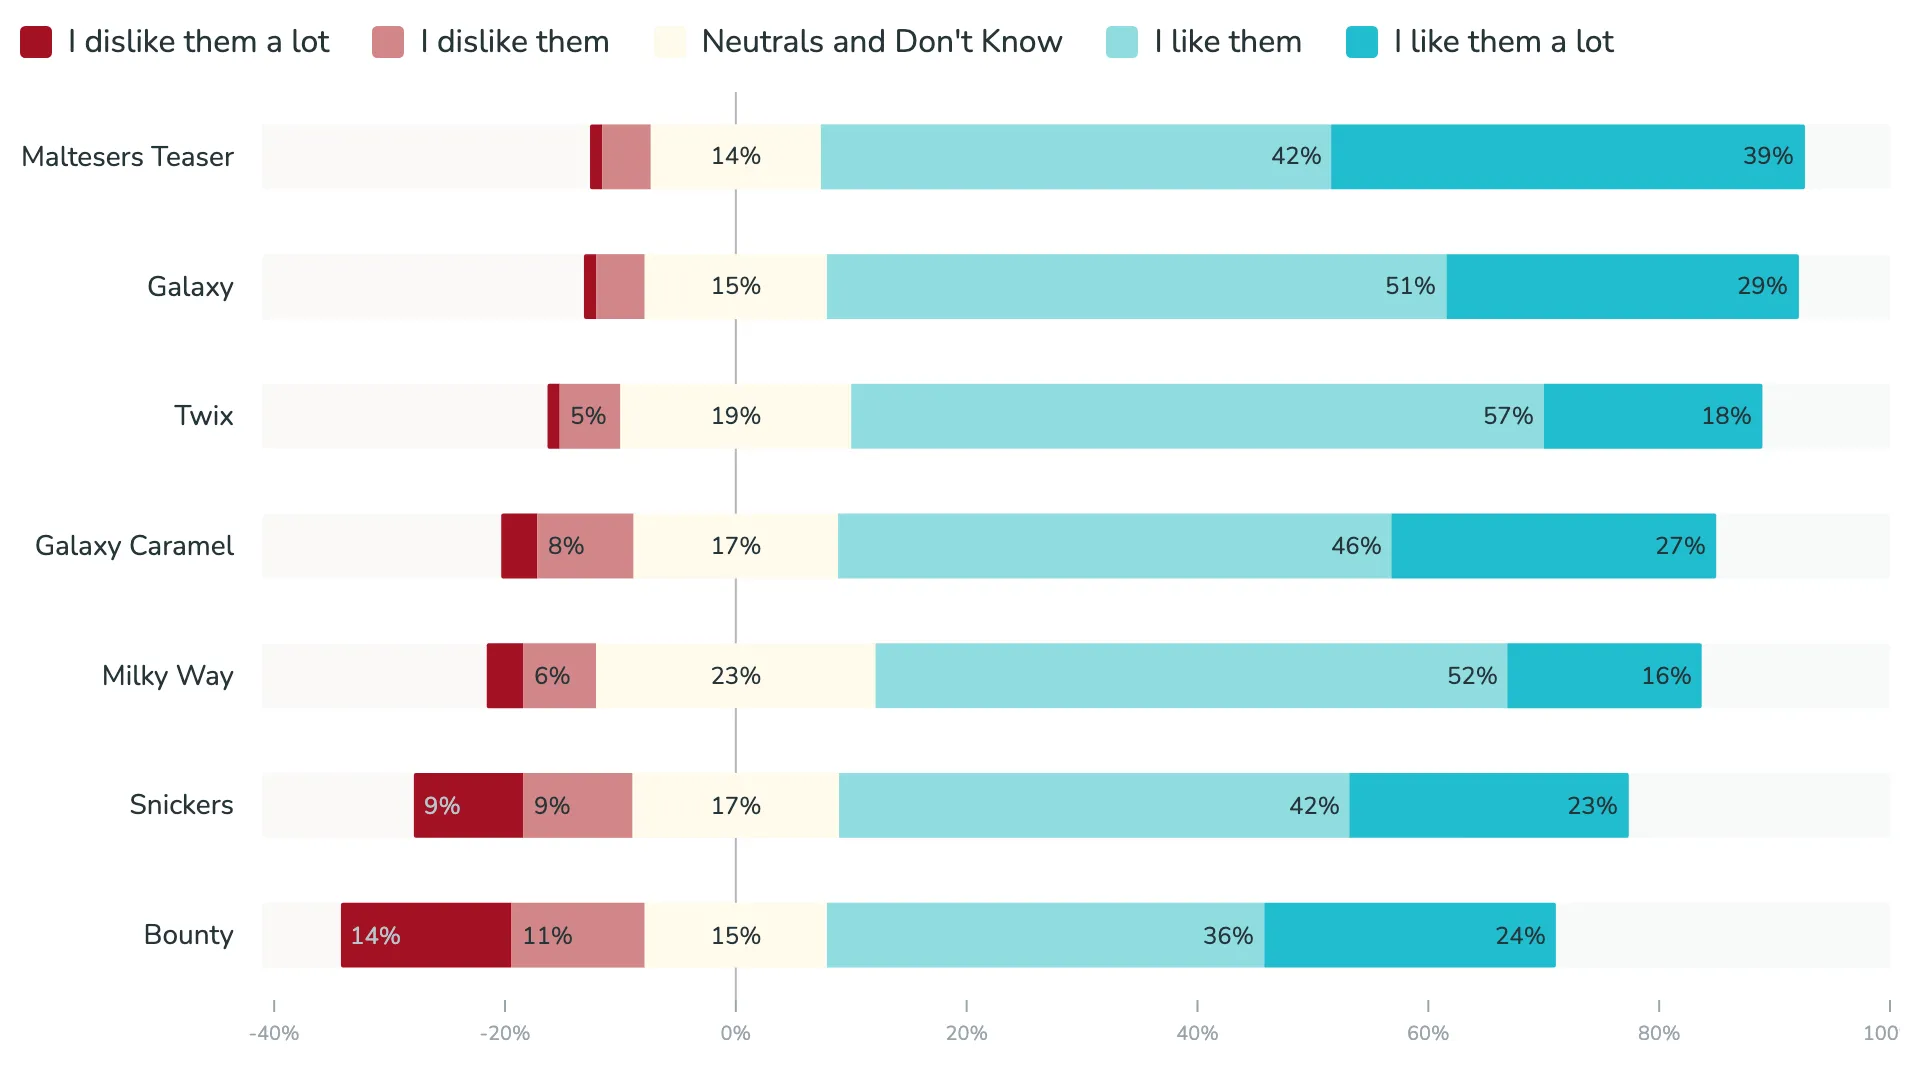
When the answer scale needs explaining, replace the direction arrows with a legend that lists every answer, from "I dislike them a lot" to "I like them a lot".
Part of the r42 family
The Likert visual shares its foundation with the other r42 visuals. Add a field to Split by, and you get small multiples: one Likert chart per department or per country, all with the same scale. Colours, number formatting, and card styling work the same way as in the scorecard, the donut, or the waffle.
Like all r42 Power BI visuals, the Likert visual is certified by Microsoft and available in English, French, and German.
Get the Likert visual from the Microsoft Marketplace and try it free for 30 days.


