Rehoboam Ring
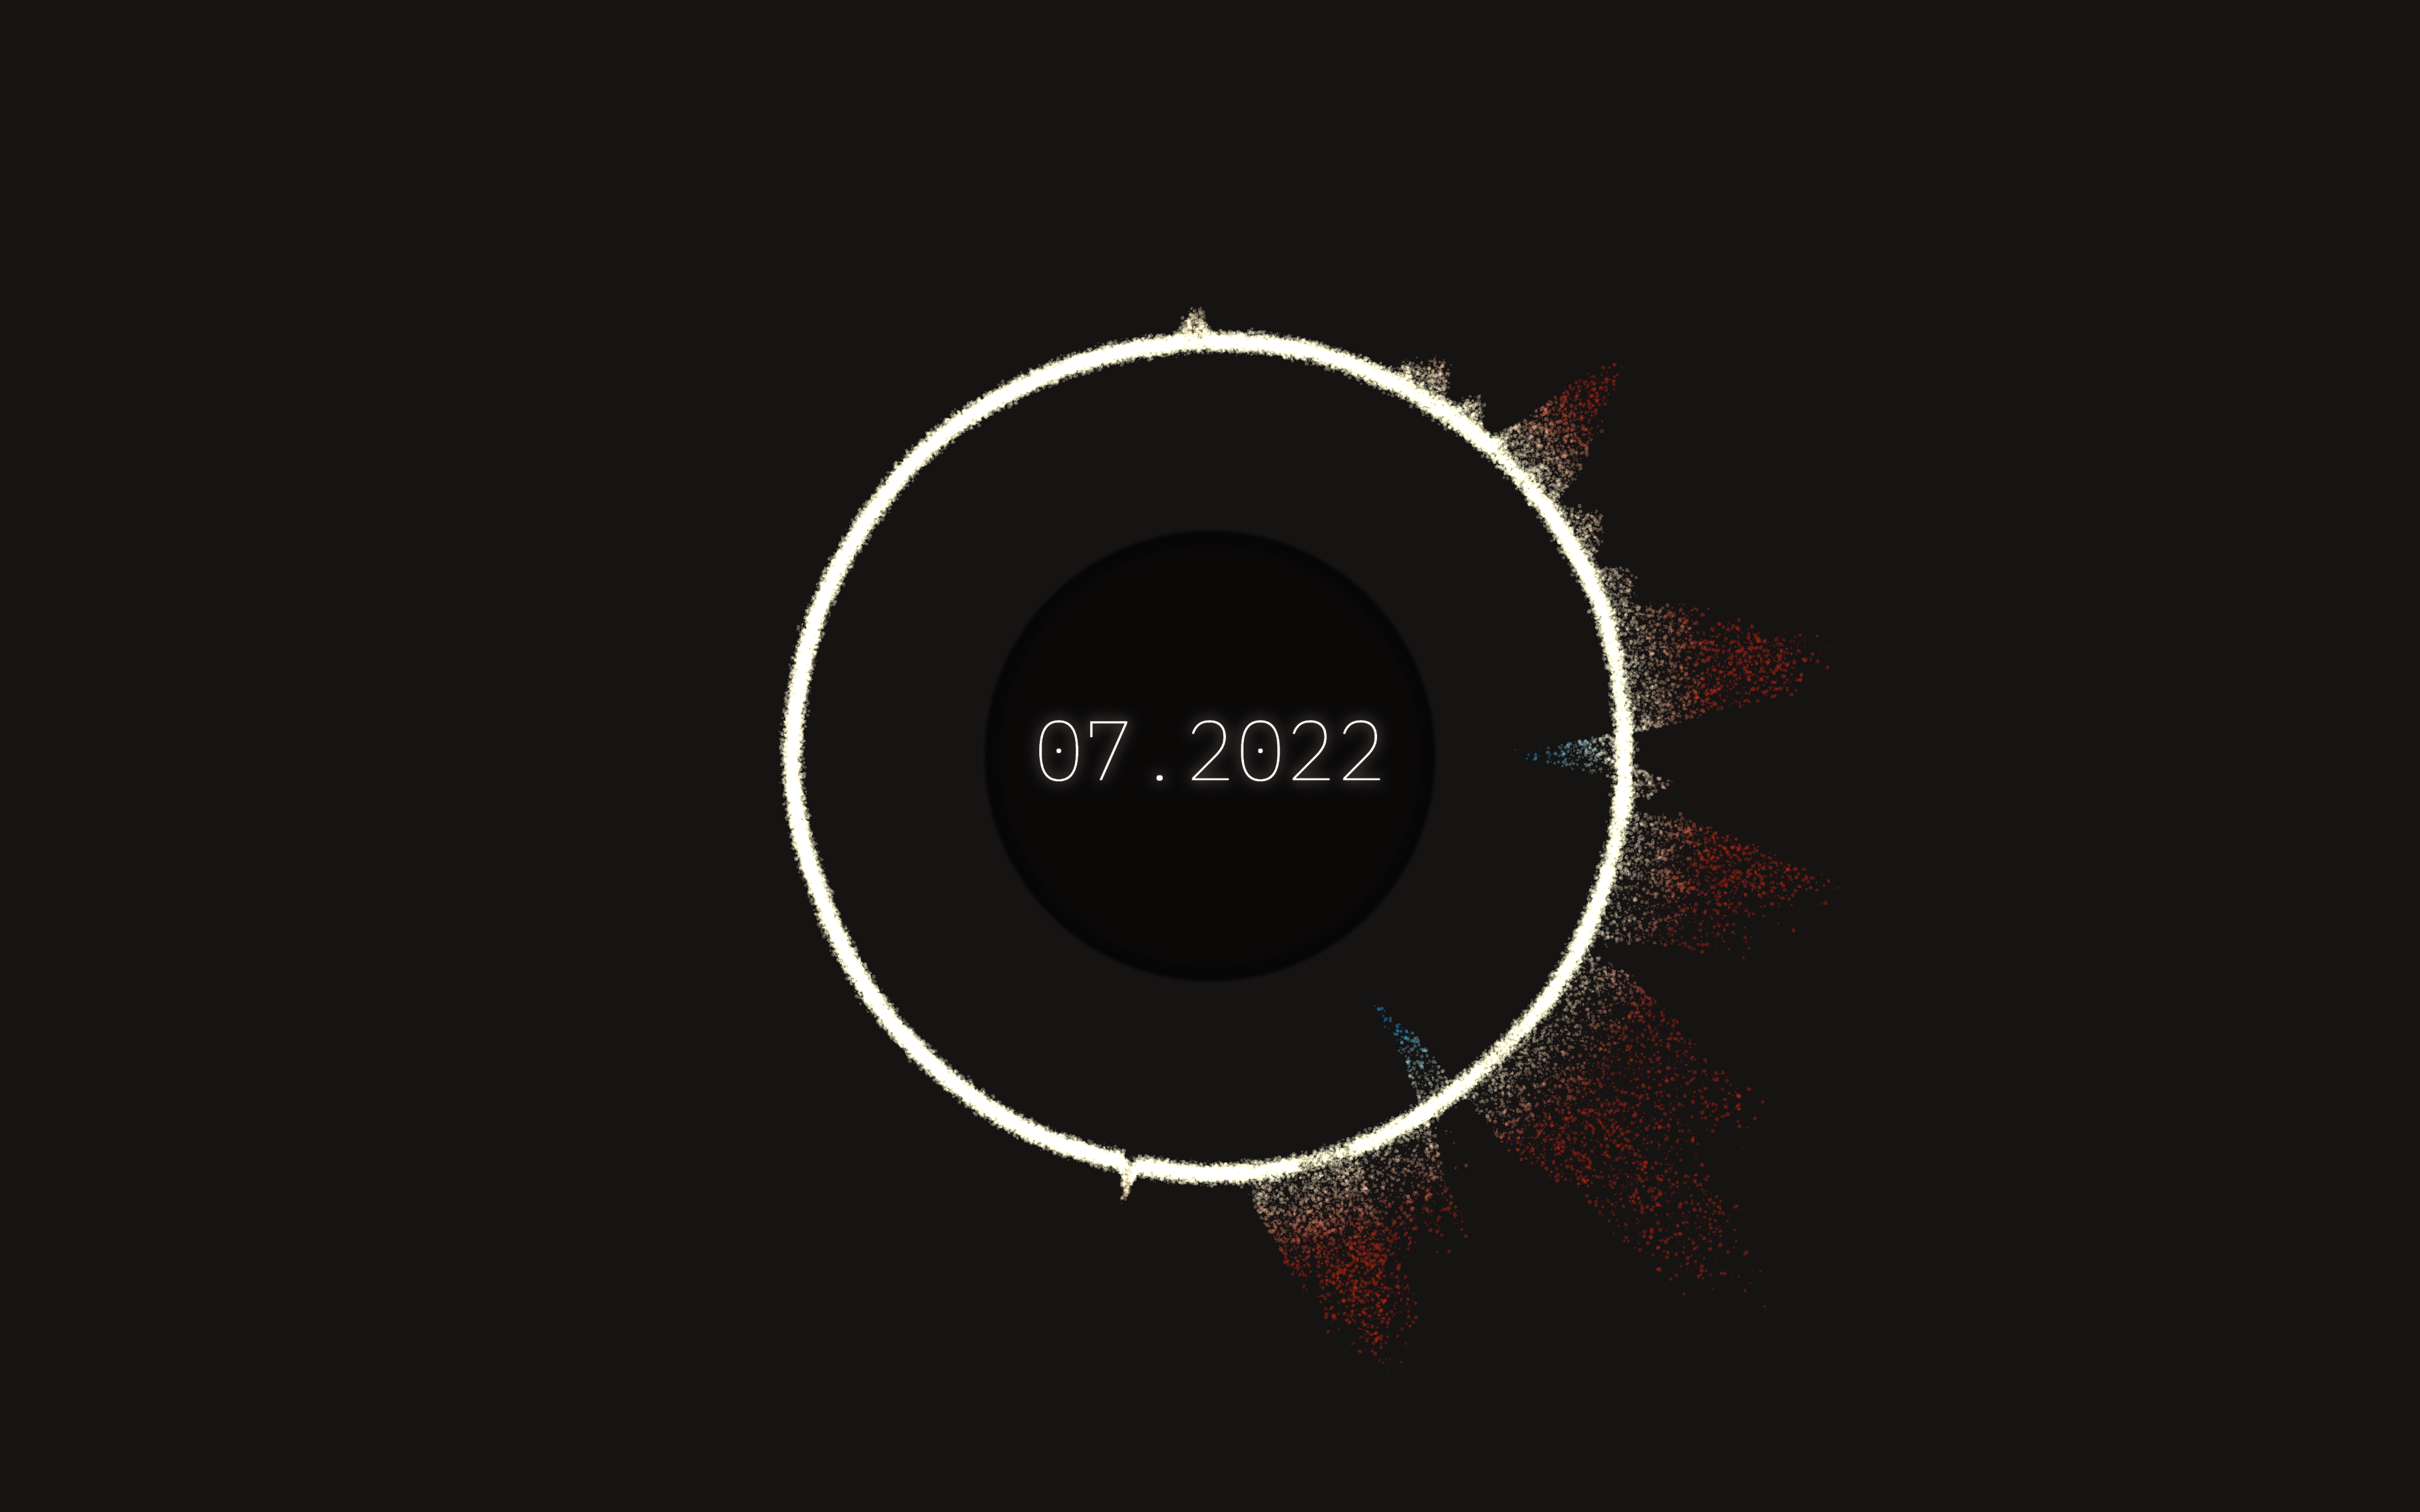
In the series Westworld, Rehoboam is a machine that predicts the future. Its interface is a ring of ink that ripples whenever something important happens. We wanted to see what that ring looks like when real data drives it.
The first dataset is the weather in London: five years of daily maximum temperatures, from 2021 to 2025.
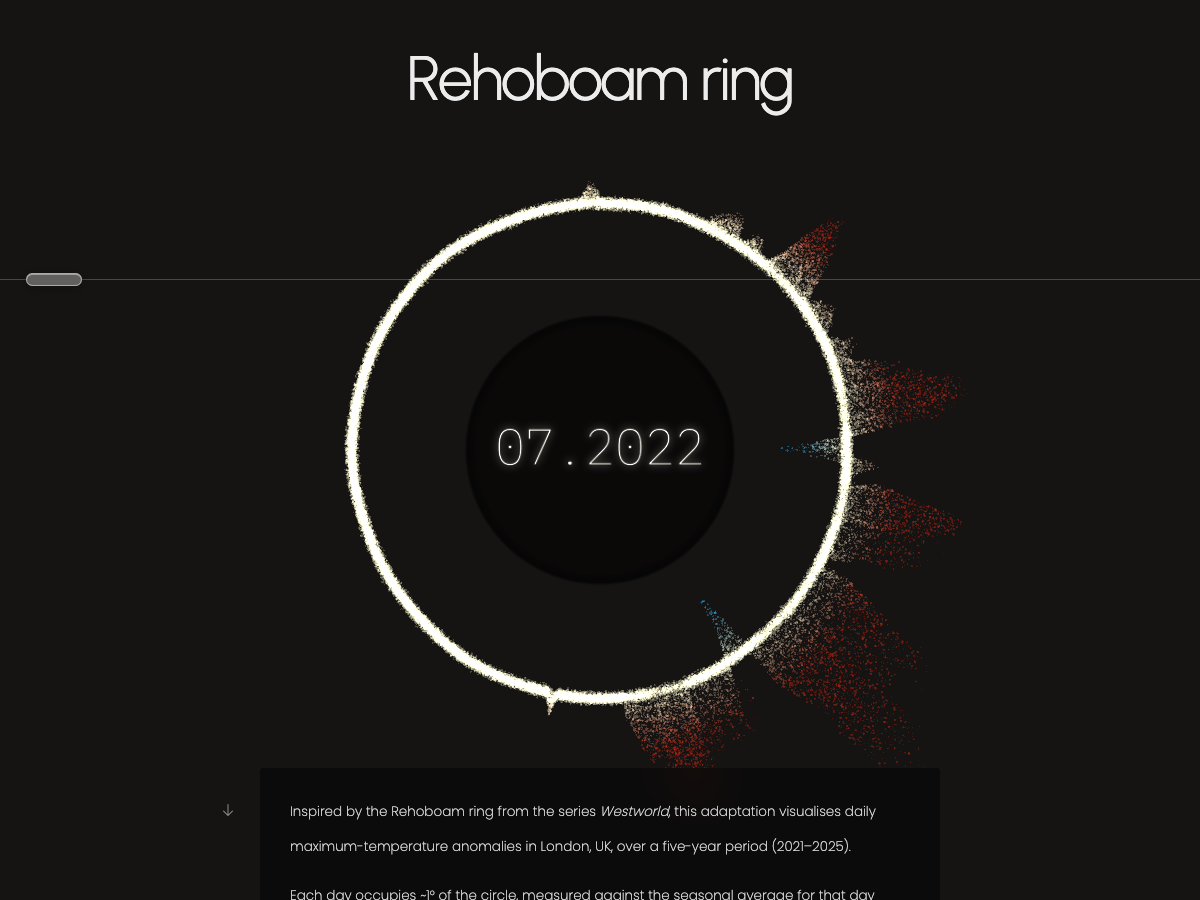
The ring is a calendar. Each day takes about one degree of the circle, and the five years play as one loop. Every day is compared to its own average over 50 years of records (1975–2024). Days more than 3 °C warmer than normal push the dots outward in orange. Colder days pull them inward in blue.
The extremes are easy to spot: +15.4 °C during the July 2022 heatwave, −8.2 °C in the December 2022 cold snap. A thin line moves down the screen as time passes. Drag its handle to jump to any moment.
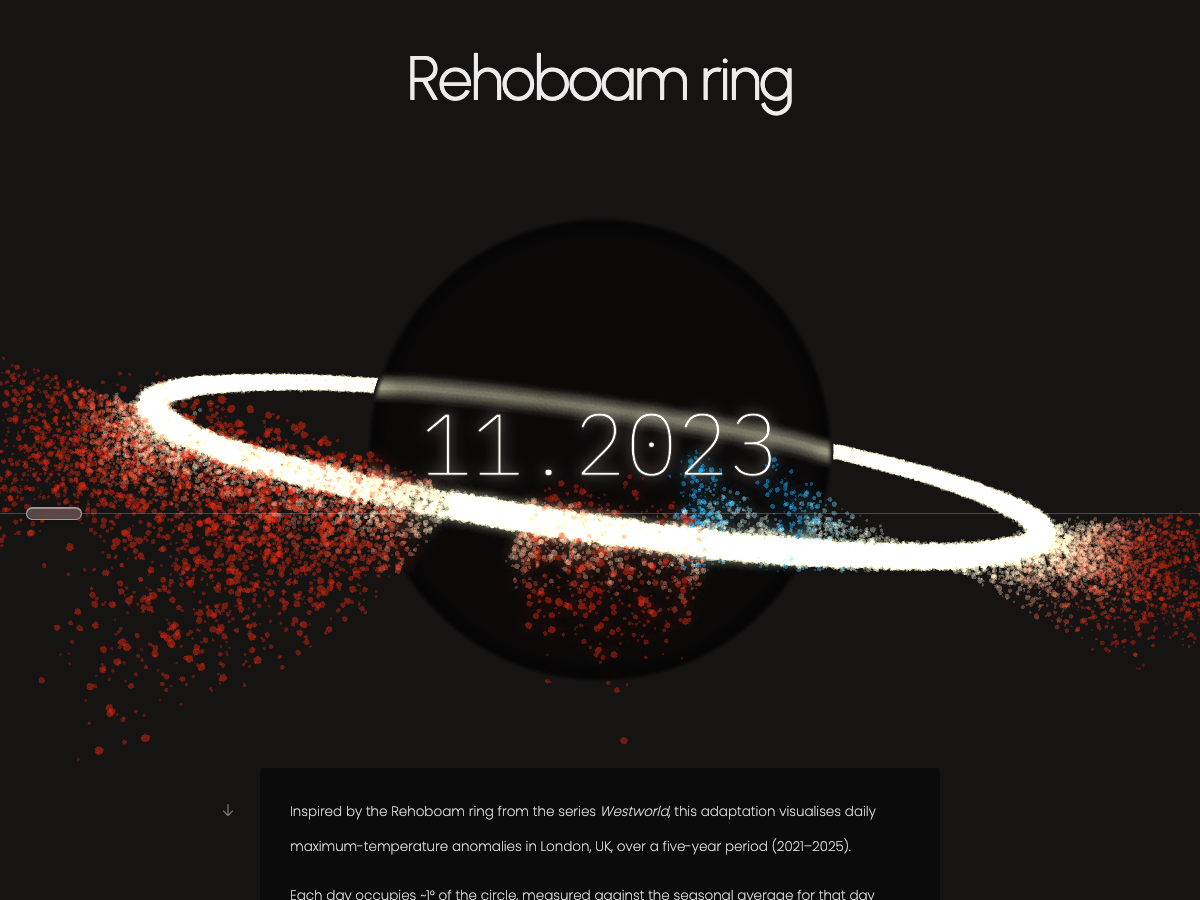
The ring is not a flat image. About 125,000 dots are rendered in 3D with Three.js. Drag to rotate, scroll or pinch to zoom. The glass plate in the centre shows the current month and year. Dots behind it look frosted, dots in front stay sharp.
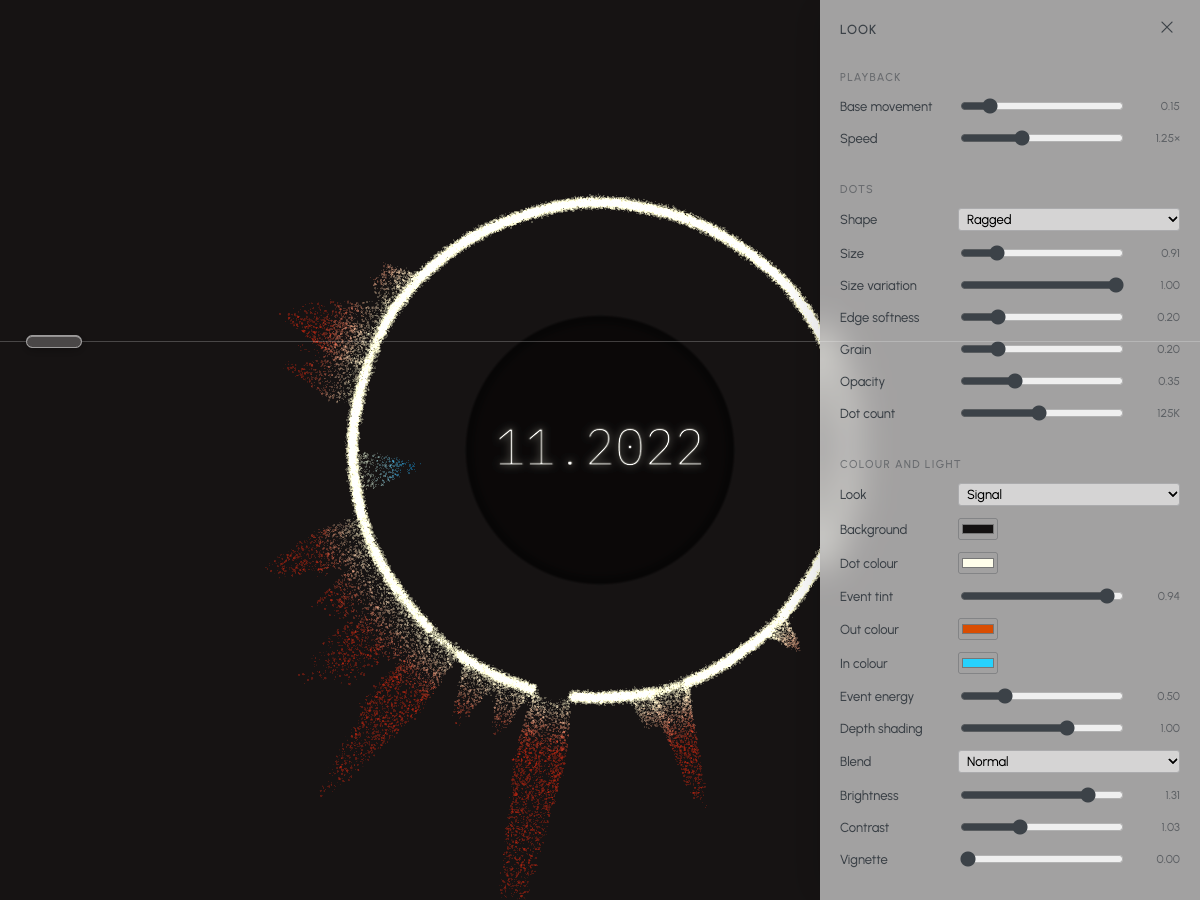
A control panel exposes every setting: dot shape, size and count, colours, light, depth of field and playback speed. The whole look can be copied as JSON and reused.
The engine itself knows nothing about weather. Any list of events with a time, an angle and a strength can drive the ring. We have already tried it with earthquakes, volcanic eruptions and nuclear tests. A new dataset is coming soon.
More case studies
Want your data to leave an impression?
Sometimes a chart isn’t enough. We can help you build a visual people remember.