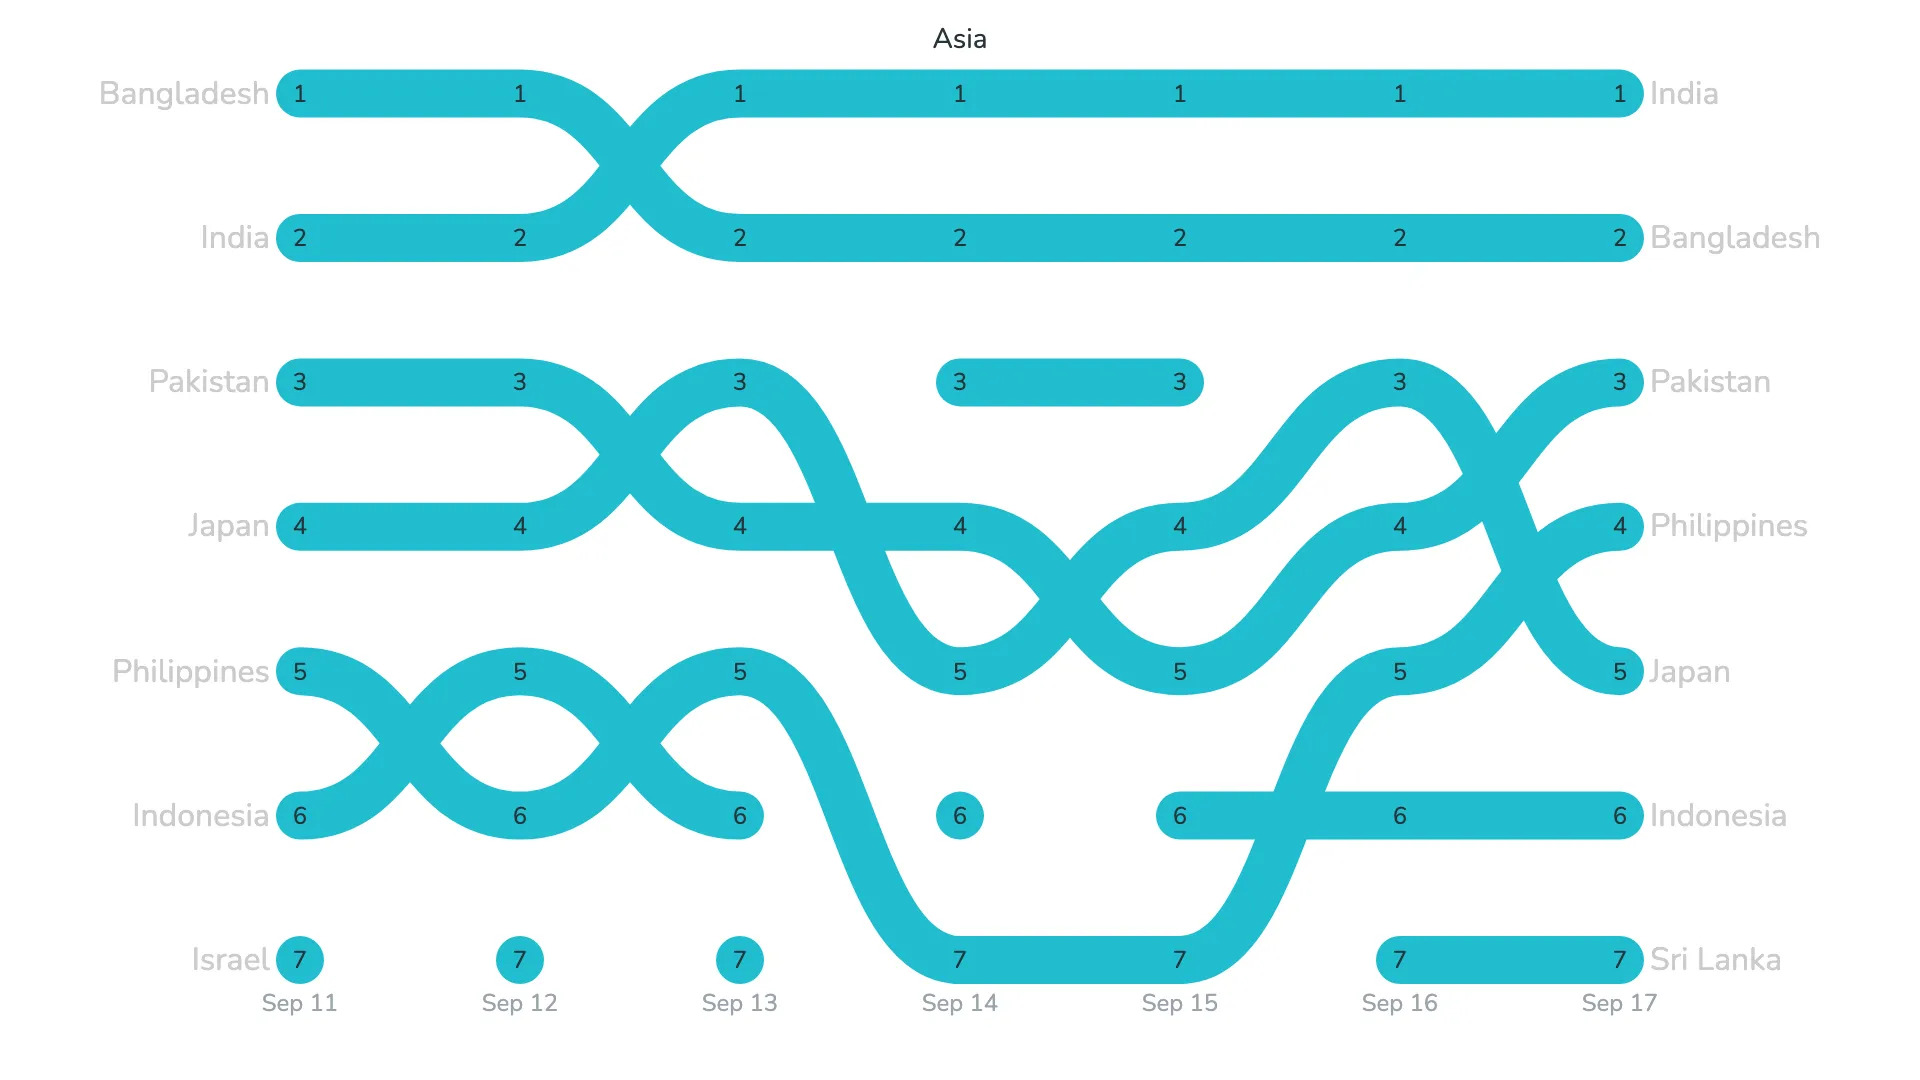
Bump chart
Bump charts show rank changes over time, providing a simpler view than a standard line chart and often producing cleaner, easier-to-read results.
Our bump chart handles all ranking calculations automatically and offers several design options, covering many common use cases for this chart type.
Gallery
Visualize ranking over time
Marketplace
Visit the Microsoft Marketplace to download this Power BI custom visual
and discover related reporting examples and report themes.
Report example
Download a report example for the Bump chart visual feature highlights.
KEY FEATURES
 Different line types
- Series labels left and right
- Small multiples
- Top N + Others
- Conditional color formatting
- Multiple options for label placement
- Flexible card design
- Filters & tooltips