Line graph
Line charts show changes over time and allow observing trends across series.
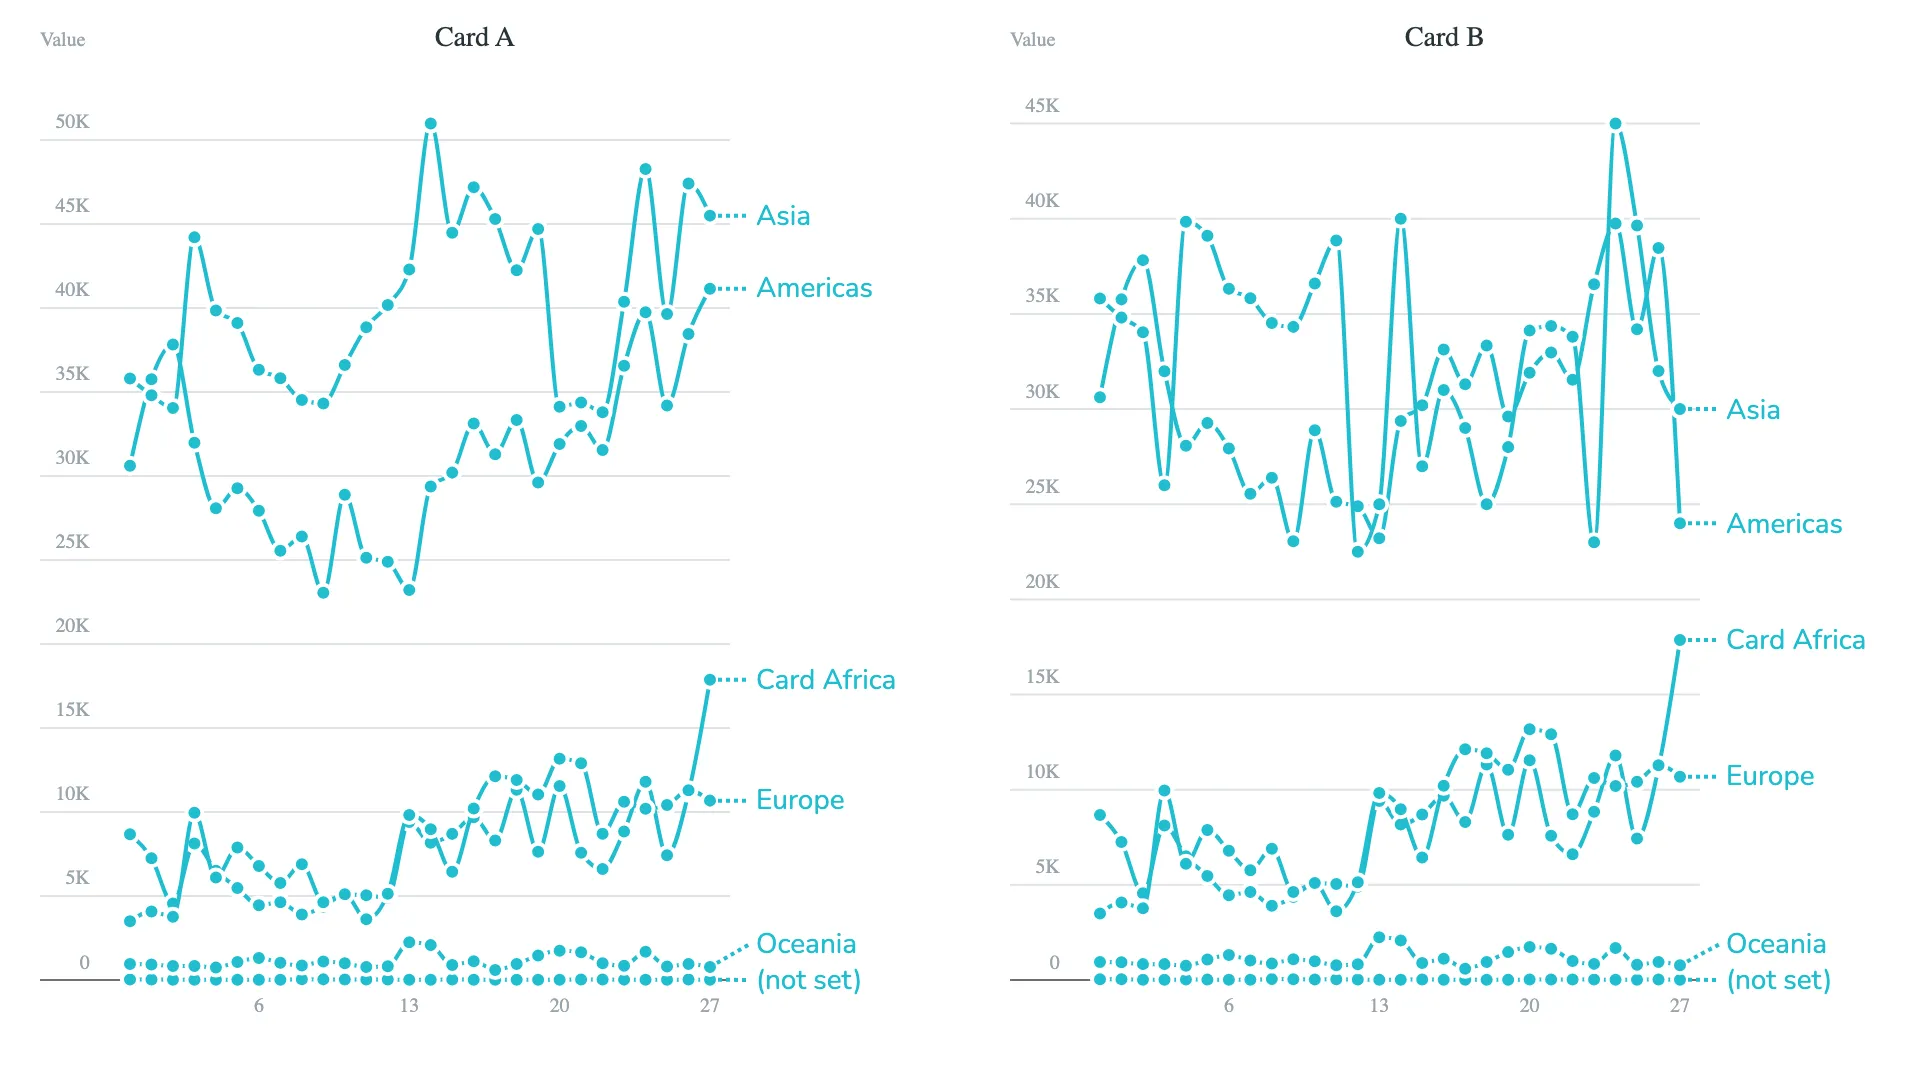
Our line chart features smart series and data labels that never overlap, ensuring readability when labels are shown. You can also highlight top series easily, making important trends stand out without extra effort.
Gallery
Visualize a single metric
Marketplace
Visit the Microsoft Marketplace to download this Power BI custom visual
and discover related reporting examples and report themes.
Report example
Download a report example for the Line graph visual feature highlights.
KEY FEATURES
 Different line types and markers
- Focus on top series
- Top N + Others
- Conditional color formatting
- Small multiples
- Automatic data label placement
- Modern axis
- Flexible card design
- Filters & tooltips