Polygon Treemap
Visualize hierarchical data, with up to two dimensions, to structure your data using irregular polygons instead of rectangles.
The shaped treemap is a versatile visual that lets you represent hierarchical data in a visually engaging way. You can choose from six shapes—Circle, Square, Triangle, Pentagon, Hexagon, or Diamond. Data labels are automatically centered within each polygon and scale linearly according to their metric values, with minimum and maximum font sizes.
Gallery
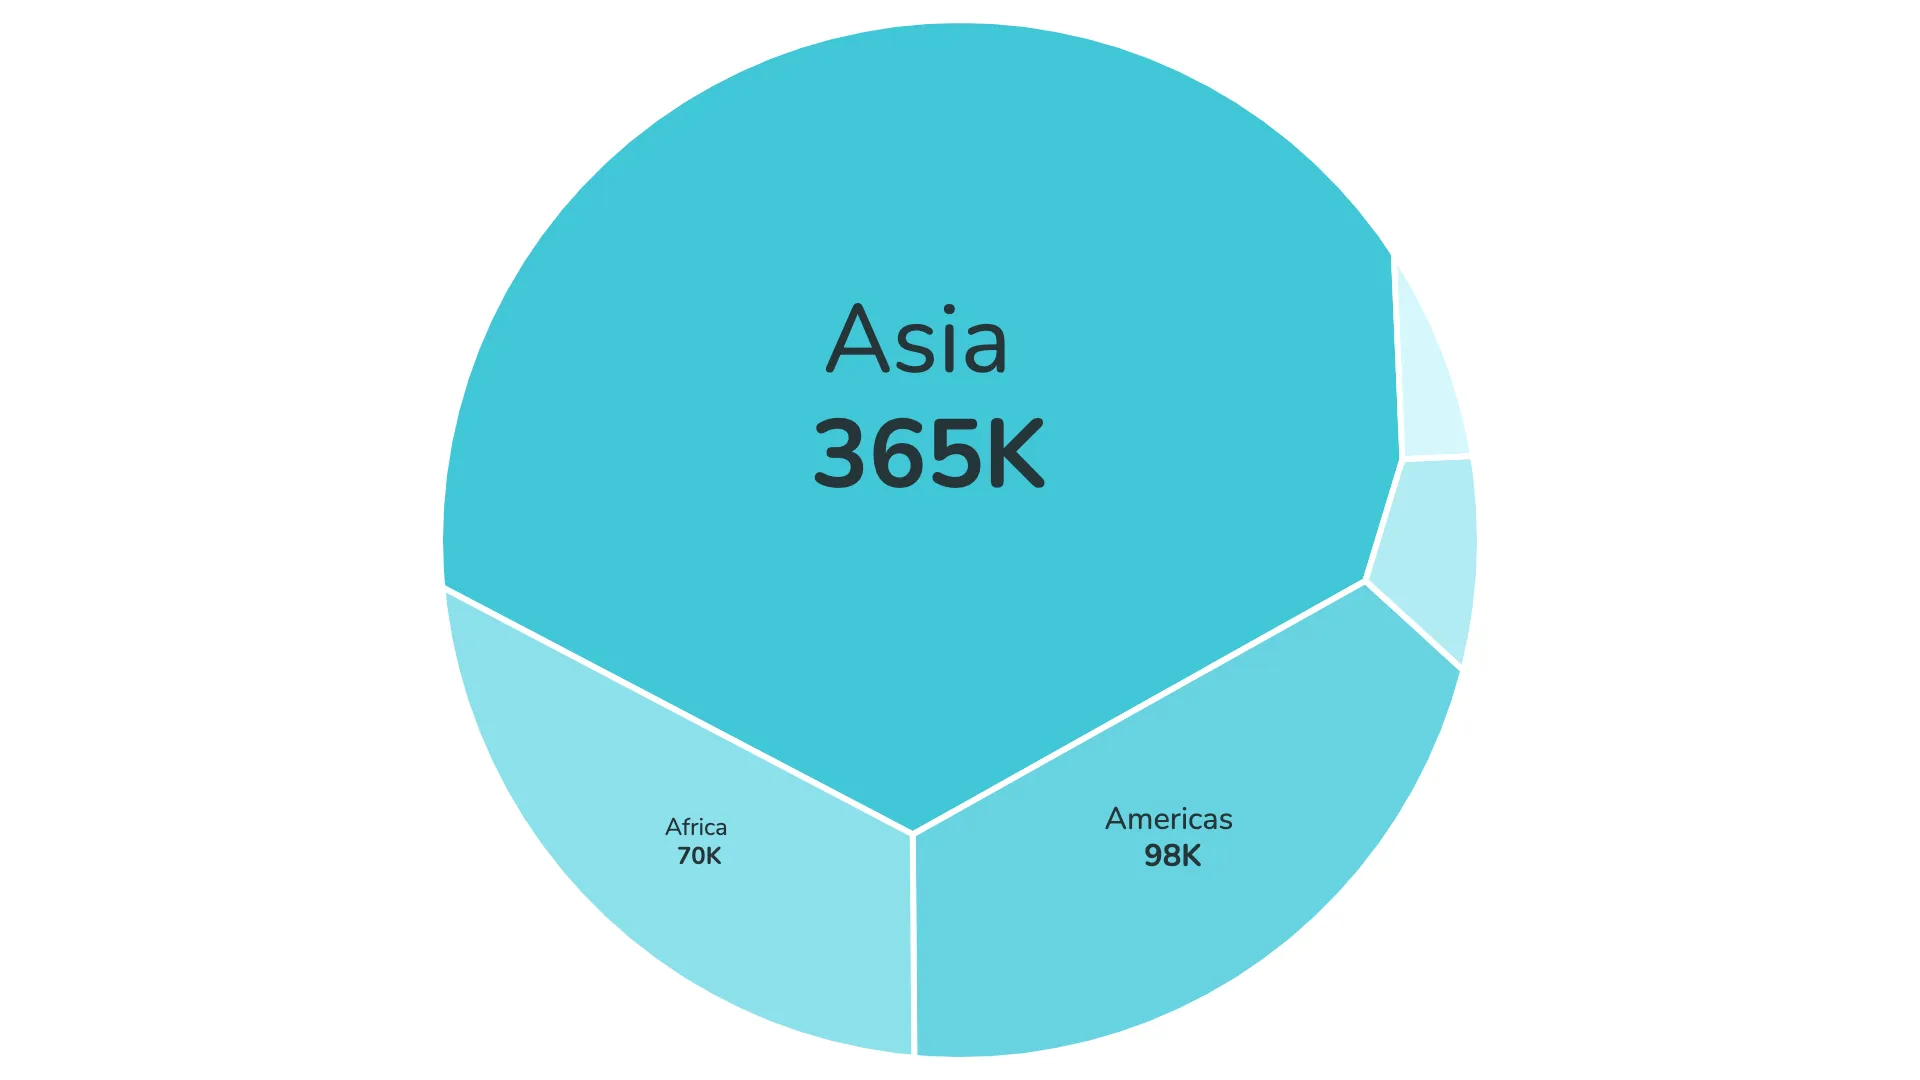
Basic Polygon Treemap
Marketplace
Visit the Microsoft Marketplace to download this Power BI custom visual
and discover related reporting examples and report themes.
Report example
Download a report example for the Polygon Treemap visual feature highlights.
KEY FEATURES
 Choose between six different shapes
- Small multiples
- Top N + Others
- Conditional color formatting
- Automatic label placement
- Circular legend
- Flexible card design
- Native and in -chart tooltips
- Use as slicer